Getting started
Welcome to QuantPy.
Disclaimer: This is a very alpha project. It is not ready to be used and won’t be for a while. In fact, the author is still very much learning what such a framework needs to entail. However, if you consider yourself a helpful soul contributions of any type are more then welcome. Thanks!
- Some current capabilities:
- Portfolio class that can import daily returns from Yahoo.
- Calculation of optimal weights for Sharpe ratio and efficient frontier
- Bare bones event profiler
Contributions Welcome.
Any and all contributions for the project are welcome whether they be feature requests, bug reports, contributions to documentation, or patches for new features, bug fixes of other improvements. Check out the [issues page](https://github.com/jsmidt/QuantPy/issues?page=1&state=open) and dig right in. Just downloading the code and providing feedback is also extremely useful. Thanks in advance.
Installing QuntPy
QuantPy may be downloaded from GitHub as:
> git clone https://github.com/jsmidt/QuantPy.git
To install QuantPy type:
> cd QuantPy
> python setup.py install
The prerequisites for Quantpy are:
- pandas (> 0.10.0)
- matplotlib (> 0.1.0)
Example Scripts Highlighting Functionality
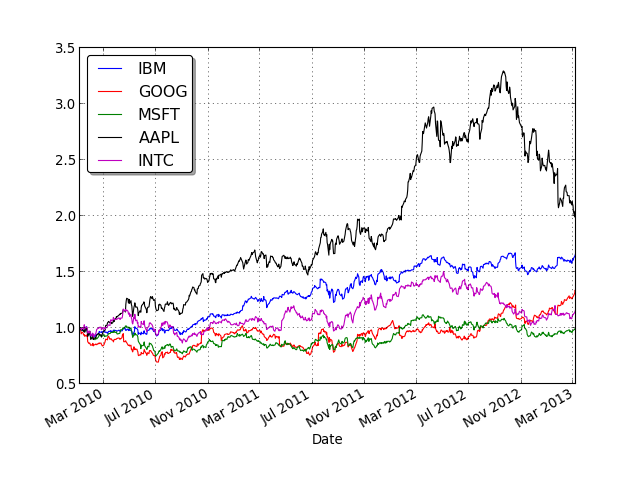
Import any portfolio and plot the returns.
The example script imports a portfolio of stocks and plots the normalized retuns:
# Example plotting returns.
from pylab import *
import quantpy as qp

# Get symbols.
syms = ['IBM','GOOG','MSFT','AAPL','INTC']
cols = ['b','r','g','k','m','y']

# Get portfolio
P = qp.Portfolio(syms)

# Make plots of normalized returns.
for sym,col in zip(syms,cols):
    P.nplot(sym,col)
show()
(Source code, png, hires.png, pdf)
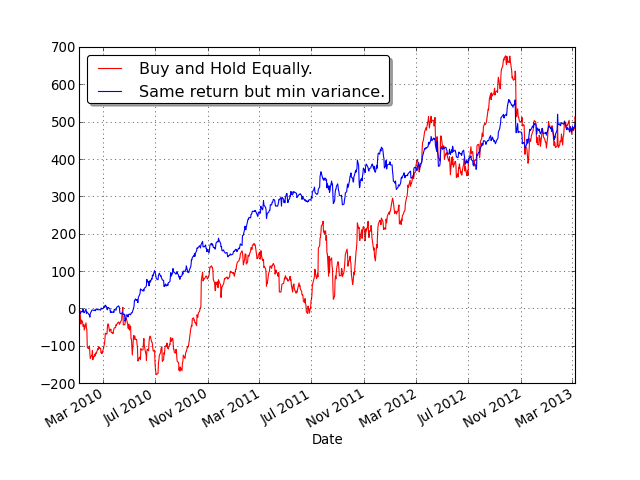
Calculate the weighting that gives minimum variance.
QuantPy can tell you the portfolio weighting that will give you the minimum variance. (Max sharpe ratio) This is illustrated in the min_variance_returns_ex.py script where you compare how your portfolio would have changed if you bought an equal number of all stocks in the portfolio versus used optimal sharpe ratio weighting for the same return.
from pylab import *
import quantpy as qp

# Get portfolio.
P = qp.Portfolio(['IBM','GOOG','MSFT','AAPL','INTC'])

# Calculate the returns buying 1 share of everything.
bb = P.ret_for_w(ones(5))
cumsum(bb).plot(color='r',label='Buy and Hold Equally.')
mm = cumsum(bb)[-1]

# Find the optimal weighting that yields the same return with minimum variance.
w = P.min_var_w_ret(mm)
aa = P.ret_for_w(w)
cumsum(aa).plot(label='Same return but min variance.')
legend(loc='best',shadow=True, fancybox=True)
show()
(Source code, png, hires.png, pdf)
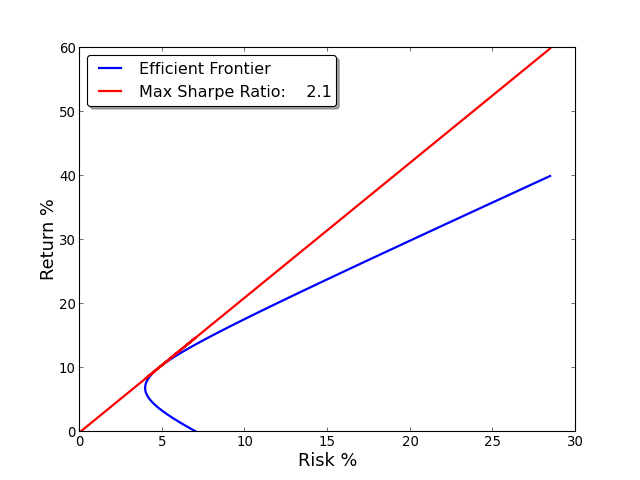
Plot the Efficient Frontier.
We can plot the entire efficient frontier as done in efficient_frontier_plot_ex.py. This is defined as followed: you tell me what returns you want and this will tell you the weighting that will generate those returns with minimum variance. The relation or risk to return for such a weighting is plotted in efficient_frontier.png. The line showing the optimal return for risk (optimal share ratio) is also plotted.
# Example plotting effienct frontier.

import quantpy as qp

# Grap portfolio
P = qp.Portfolio(['GOOG','IBM','INTC','MSFT','AAPL'])

# Plot effiecent frontier
P.efficient_frontier_plot()
(Source code, png, hires.png, pdf)
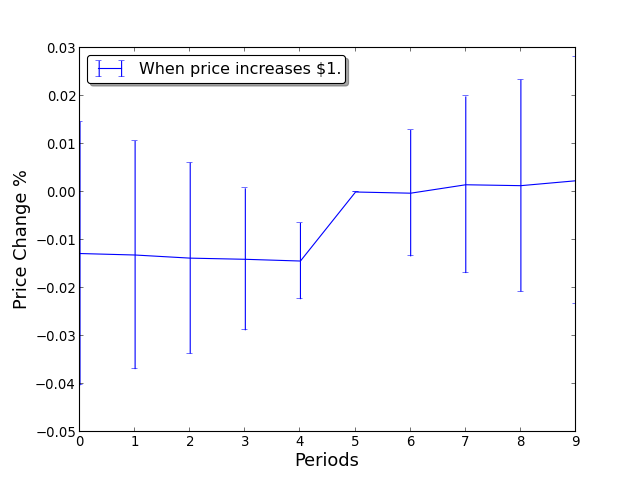
Using an Event Profiler
Event profiler allows you to track what happens to a stock price after historical events. Tell me any event, like an EMA cross, and this will plot how the price historically has changed with such an event with error bars. This helps us find statistically meaningful events.
Below is a bare bones version of this demonstrated by running event_ex.py. It just asks what happens to the price after it goes up at least $1. As the plot event_ex.png shows, nothing meaningful. Notice you must create your own “truth function” describing your event.
import quantpy as qp
from numpy import *


# Create your own truth function describing your even.
# In this case the event is: whenever the price chanegs $1.
def truth_function(asset):
    truth = zeros(len(asset))
    for i in range(1,len(asset)):
       if  asset[i] - asset[i-1] > 1.0:
           truth[i] = 1
    return truth


# Grab a profile
P = qp.Portfolio(['GOOG','IBM','INTC'])

# Define your asset you want to test.
asset = P.asset['IBM']['Adj Close']

# Generate your truth function.
truth = truth_function(asset)

# Get profiles for these events
profiles = qp.event_profiler(asset,truth)

# Plot them
qp.plot_event_profile(profiles,name='When price increases $1.')
(Source code, png, hires.png, pdf)
Thanks Again!
We want to thank you for trying out QuantPy. Any contributions are again very appreciated.